A coffee shop profit and loss statement is a financial report that summarises your revenue, cost of goods sold, operating expenses, and net profit over a set period, typically one month or one year. It tells you, plainly, whether your cafe is making or losing money, and exactly where the pressure is coming from.
To read a P&L, work top to bottom: start with total revenue, subtract the cost of goods sold to get gross profit, then subtract every operating expense to land on net profit. That final figure is what you actually keep. If you want to understand coffee shop profit margins at a structural level, the P&L is the only document that shows you all the inputs at once.
Most independent cafes target a net profit margin somewhere between 5% and 15%, though the range varies significantly by location, format, and labour model. Understanding what a healthy coffee shop profit margin looks like helps you judge whether your own numbers represent a problem or simply reflect your market.
What Goes on a Coffee Shop Profit and Loss Statement
A coffee shop P&L has five building blocks: revenue, cost of goods sold, gross profit, operating expenses, and net profit. Every line item on your statement fits into one of these categories, and understanding what each one measures is the first step to managing it.
Revenue
Revenue is the total money your cafe takes in before any costs are deducted. For most coffee shops this means espresso-based drinks, brewed coffee, food items, retail merchandise, and any catering or events income. Keep these streams separated in your accounting so you can see which channel is actually growing. How to profit from a coffee shop covers the revenue mix in more detail, but on the P&L, the key question is always: is total revenue trending up or flat?
Cost of Goods Sold (COGS)
COGS covers the direct costs of what you sell: coffee beans, milk, syrups, food ingredients, and packaging. Industry estimates generally place COGS for a cafe in the range of 25% to 35% of revenue, with well-run specialty coffee operations often sitting closer to the lower end. If your COGS climbs above 35%, that is worth investigating before anything else on the statement.
Gross Profit
Gross profit is revenue minus COGS. It tells you what you have left to cover every other cost in the business. A gross profit margin below 65% is a warning sign for most cafe formats. Many operators skip straight to net profit and miss the fact that the real damage happened at the gross profit line.
Operating Expenses
This is where most of the complexity lives. Operating expenses include:
- Labour (wages, payroll taxes, tips): typically the largest single cost, often running 35% to 45% of revenue in owner-operated cafes
- Occupancy (rent, utilities, insurance): usually 10% to 20% depending on market
- Marketing and administration: variable, but commonly 2% to 5% for independent shops
- Depreciation and maintenance: equipment replacement and repairs
Net Profit
Net profit is what remains after all costs. This is the number that determines whether your cafe is financially viable over time. A positive net profit of even 8% to 10% represents a well-managed independent cafe.
A Sample Coffee Shop P&L: What One Actually Looks Like
The clearest way to understand a coffee shop P&L is to see one. The figures below are illustrative benchmarks based on a mid-volume independent cafe doing roughly $30,000 in monthly revenue. They are not guarantees, but they reflect ranges that what average coffee shop profits look like consistently shows up in independent cafe economics.
| Line Item | Monthly ($) | % of Revenue |
|---|---|---|
| Revenue | ||
| Beverage Sales | 21,000 | 70.0% |
| Food Sales | 7,500 | 25.0% |
| Retail / Merchandise | 1,500 | 5.0% |
| Total Revenue | 30,000 | 100% |
| Cost of Goods Sold | ||
| Beverage COGS | 5,250 | 17.5% |
| Food COGS | 3,000 | 10.0% |
| Retail COGS | 450 | 1.5% |
| Total COGS | 8,700 | 29.0% |
| Gross Profit | 21,300 | 71.0% |
| Operating Expenses | ||
| Labour (wages + payroll) | 10,500 | 35.0% |
| Rent | 3,600 | 12.0% |
| Utilities | 900 | 3.0% |
| Insurance | 300 | 1.0% |
| Marketing | 450 | 1.5% |
| Supplies & Admin | 600 | 2.0% |
| Depreciation | 450 | 1.5% |
| Total Operating Expenses | 16,800 | 56.0% |
| Net Profit | 4,500 | 15.0% |
Three lines tend to surprise owners who see them in their own statements.
Labour at 35% looks reasonable on paper, but many cafes discover their actual labour percentage is several points higher once payroll taxes and tip contributions are included. Run the real number, not the wages-only number.
Retail COGS at 1.5% shows how low the cost of stocked merchandise can be relative to its revenue contribution, especially when that retail line includes consignment products that carry near-zero COGS for you.
Net profit at 15% represents a well-run month. Many independent cafes operate at 5% to 10%, so if your statement lands there, you are not failing. You are typical.
Coffee Shop P&L Benchmarks: How Your Numbers Compare
Knowing your own numbers is only useful when you have a reference point. The table below gives you industry benchmark ranges for each major P&L line, along with the warning signal that suggests a number needs attention. These ranges reflect general estimates across independent cafe operations; your format, market, and ownership model will shift them.
| P&L Line | Industry Benchmark (% of Revenue) | Warning Signal |
|---|---|---|
| COGS | 25%, 35% | Above 37%: review supplier pricing and waste |
| Labour | 35%, 45% | Above 45%: examine scheduling and staffing model |
| Occupancy (rent + utilities) | 10%, 20% | Above 22%: revenue may be too low for the lease |
| Marketing | 1%, 4% | Below 1%: growth may stall; above 6%: audit ROI |
| Other Operating | 3%, 6% | Above 8%: uncontrolled miscellaneous spend |
| Gross Profit Margin | 65%, 75% | Below 63%: COGS or pricing is the primary problem |
| Net Profit Margin | 5%, 15% | Below 3%: the business is not sustainably profitable |
When one of your numbers sits outside these ranges, the next step is not to panic. It is to isolate the cause. An occupancy ratio of 22% is not automatically a crisis if your revenue is growing toward the lease cost. Context matters.
If your labour percentage is running high, look at scheduling efficiency first: are you overstaffed during low-traffic periods? If your gross profit margin is low, the culprit is almost always COGS or pricing, not operating expenses, which sit below the gross profit line. Targeting the right layer of the P&L saves you from cutting costs in the wrong place.
For context on alternative revenue structures, non-profit coffee shop models operate with different margin expectations entirely, which is a useful comparison when thinking about what "acceptable" profit means for your specific situation.
How to Read Your P&L and Act on What It Shows
Reading a P&L means working through it in a deliberate sequence, not jumping to net profit and stopping there. The most useful P&L reviews follow the same four-step pattern every month.
Step 1: Set a monthly cadence. Review your P&L on the same date each month, using the prior month's closed figures. Quarterly reviews are too infrequent to catch problems before they compound. When running a coffee retail shop, monthly reviews are the minimum standard.
Step 2: Read top to bottom, always. Start at total revenue. Is it up, flat, or down versus the prior month and versus the same month last year? Then move to COGS and gross profit before you look at a single operating expense. Many operators spend 20 minutes on labour and never notice that gross profit margin shrank by four points because a supplier raised prices.
Step 3: Isolate one variance at a time. If something is off, pick the single largest out-of-range line and trace it back before moving to the next. Ask: did volume change, did unit cost change, or did both move? A COGS spike and a labour spike have different root causes and different fixes.
Step 4: Commit to one action per review cycle. A COGS spike above 35%: request itemised invoices from your main supplier and check for portion drift on high-cost items. A labour spike: pull the scheduling report and compare hours-to-covers for the period. A revenue dip: check your transaction count. Fewer transactions suggests a traffic problem, while a stable transaction count with lower revenue suggests a ticket-size problem. One diagnosis, one action, one month.
Adding a Retail Revenue Line: How Shelf Space Affects Your P&L
Retail revenue can improve a coffee shop P&L significantly, and the reason is structural: when products are placed on consignment, the host cafe earns a split of each sale without purchasing any inventory upfront. That means the revenue flows almost directly to gross profit, with near-zero COGS on your side of the ledger.
This is how consignment retail changes the P&L math. A traditional retail line carries its own COGS: you bought the stock, so you carry the cost. A consignment line means a maker has placed their products in your space. You earn a percentage of each sale, and the maker handles the product cost. Your P&L shows revenue with minimal corresponding cost, which lifts your gross profit margin without increasing operating expenses.
SideStore's Retail Widget is built precisely for this kind of placement. It handles the full consignment workflow: a maker places their products in your space, customers pay via a scan-to-pay QR card (one function of the Widget, not the whole product), and the system tracks live stock levels and automatically splits each payout between you and the maker. You do not manage inventory, process returns, or chase settlement.
From a P&L standpoint, how cafes can make money from unused shelf space is a direct gross profit story, not a volume play. Even a modest consignment retail line of $500 to $1,500 per month can add one to three percentage points to your gross profit margin, with almost nothing added to COGS. Understanding how consignment works is the starting point if you want to model this as a line item before committing. You can also explore make money from unused shelf space for a broader look at the mechanics.
Five Mistakes Coffee Shop Owners Make on Their P&L
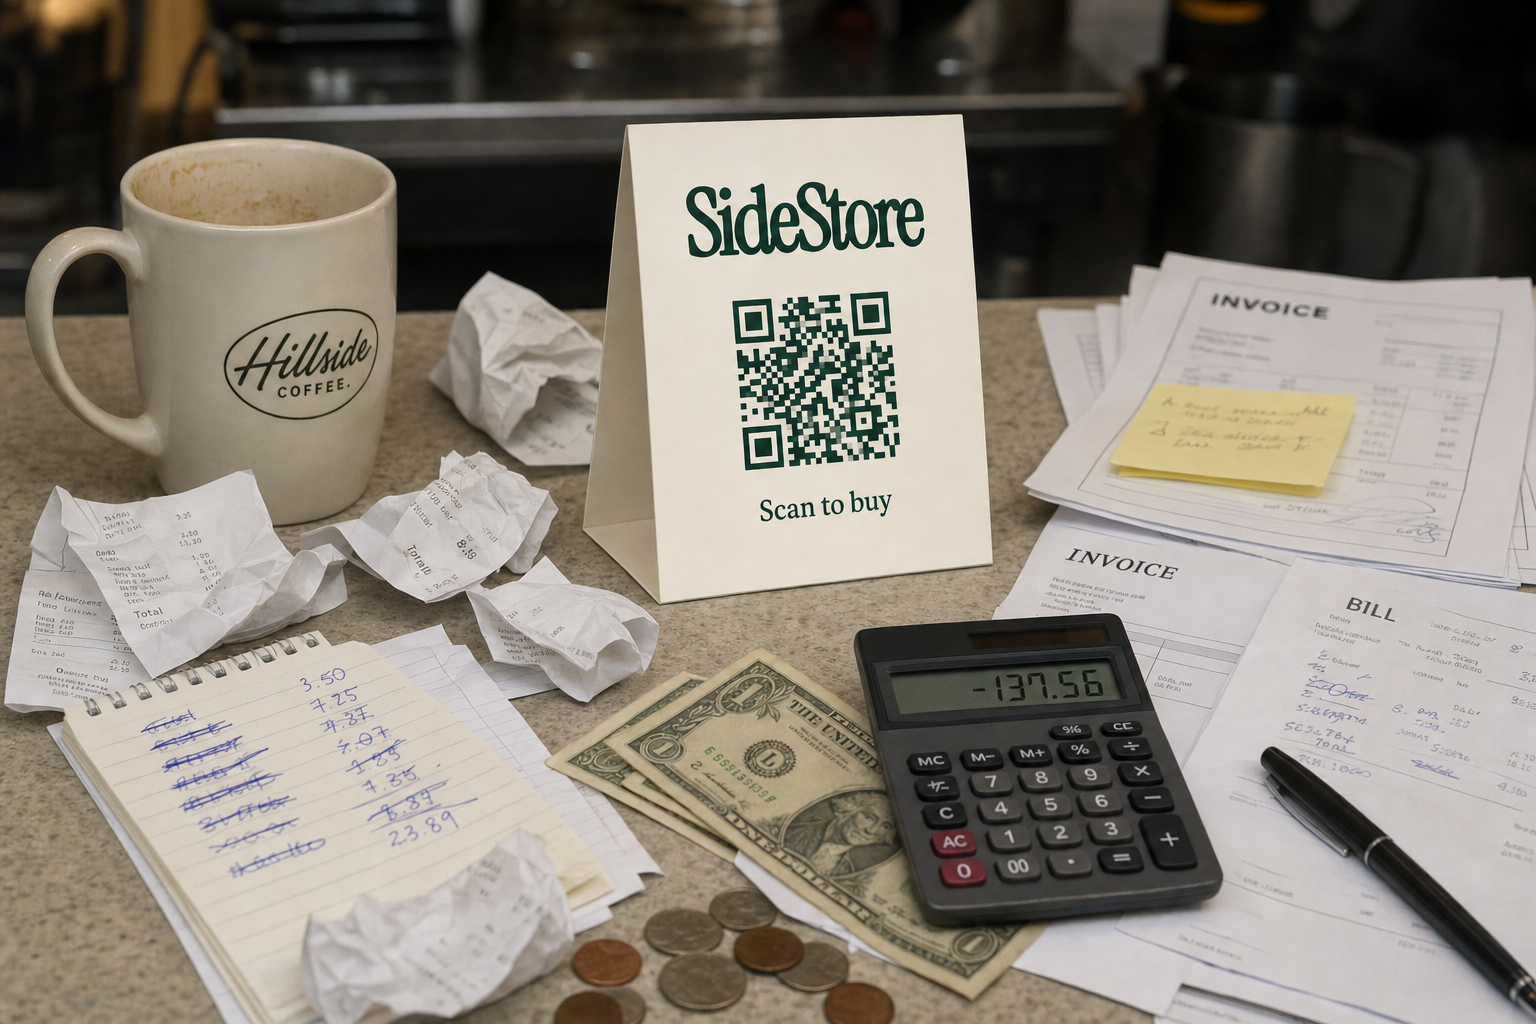
The most common P&L mistakes are not mathematical errors. They are structural oversights that distort the picture and lead to wrong decisions. Here are five specific ones, each with a concrete consequence.
1. Combining All Revenue Into One Line
When espresso sales, food, and retail merchandise are lumped into a single revenue figure, you cannot see which category is growing or shrinking. The consequence: you may continue promoting a product category that is actually dragging down your average margin, while a high-margin category goes unnoticed and under-invested.
2. Excluding Owner Draws From Labour Costs
If you work in the shop and pay yourself via owner's draw rather than a formal wage, that cost does not appear in labour on the P&L. The consequence: your labour percentage looks artificially low, and your net profit looks artificially high. Industry estimates suggest this can overstate net profit by several percentage points in owner-operated cafes.
3. Reviewing the P&L Quarterly Instead of Monthly
A quarterly review means you may be three months into a COGS problem before you act. The consequence: a supplier price increase or a portion-control issue that would have cost you $600 in month one costs you $1,800 before you catch it.
4. Treating Depreciation as Optional
Skipping depreciation makes net profit look better on paper, but your espresso machine and grinders will need replacing. The consequence: an apparent profit that evaporates when capital equipment fails and you have no reserve.
5. Ignoring Idle Shelf Space as a Revenue Opportunity
Blank shelving and empty display cases appear nowhere on the P&L, but how high-traffic retailers monetize idle shelf space shows that unused physical space is an untapped gross-profit line. The consequence: cafes that host consignment products routinely add revenue with near-zero additional cost, while cafes that leave shelves empty leave that margin on the table.
Frequently Asked Questions
What is a good net profit margin for a coffee shop?
Industry estimates generally place a healthy net profit margin for an independent coffee shop between 5% and 15%. Specialty cafes with strong retail revenue and efficient labour models can exceed 15%, while high-rent urban locations often land at the lower end of that range. See coffee shop profit margin benchmarks for a fuller breakdown.
How often should a coffee shop owner review the P&L?
Monthly is the minimum workable cadence. Monthly reviews give you enough data to spot trends but enough frequency to catch problems before they compound. Quarterly reviews are too slow for a high-variable business like a cafe, where food costs and labour hours can shift significantly week to week.
What is the difference between a P&L and a cash flow statement?
A P&L shows whether your business is profitable over a period: it matches revenue to the costs that generated it. A cash flow statement shows the actual movement of cash in and out of your bank account. A cafe can show a profit on the P&L while experiencing a cash shortfall. For example, if a large supplier invoice falls due before a busy weekend's revenue clears, cash flow tightens even though the P&L looks healthy.
Can I use a spreadsheet for my coffee shop P&L?
Yes. A spreadsheet is a practical starting point, especially for a single-location independent cafe. The key is consistency: use the same categories every month so you can compare periods accurately. As your operation grows or you add revenue lines like consignment retail, purpose-built accounting software makes the process faster and reduces manual error.
Next Steps: Turn Your P&L Into a Management Tool
Your coffee shop profit and loss statement only earns its value when you act on it. The practical next step is straightforward: pull last month's P&L, read it top to bottom in one sitting, and identify the single most out-of-range line. Then set one action for this month based on what you find.
Two concrete moves to make this week: first, separate your revenue into distinct categories if you have not already. Second, calculate your actual gross profit margin and check it against the 65% to 75% benchmark range.
If you have idle shelf space, adding a consignment retail line is a low-effort gross profit lever with near-zero COGS. How cafes can earn from unused shelf space explains the mechanics. Or if you want to explore product curation without inventory risk, see adding local products without buying inventory.